PyWFM Tutorial 2#
Created by: Tyler Hatch/DWR
Description: This tutorial walks a user of pywfm through how to obtain the aquifer horizontal K values and plot them.
Important
This tutorial assumes the model has run successfully and all outputs are available to use for inquiry
Getting Started#
import numpy as np
import pandas as pd
import matplotlib.pyplot as plt

from pywfm import IWFMModel
Set Paths to the Preprocessor Input File and Simulation Input File#
# specify paths to preprocessor and simulation main files
pp_file = '../Preprocessor/PreProcessor_MAIN.IN'
sim_file = 'Simulation_MAIN.IN'
Important
These paths assume this code is saved in the simulation folder of the Sample Model and the DLL is in a location relative to the simulation folder
Create the Model Object#
sm = IWFMModel(pp_file, sim_file)
Retrieve Node IDs and Node Coordinates#
nodes = sm.get_node_info()
Note
the get_node_info method returns the data in a pandas DataFrame object
Retrieve Horizontal Hydraulic Conductivity values at each nodes#
aquifer_hk = sm.get_aquifer_horizontal_k()
Add Hydraulic Conductivities for each layer to the nodes DataFrame#
for i in range(aquifer_hk.shape[0]):
    nodes['Layer{}_HK'.format(i+1)] = aquifer_hk[i]
Plot Hydraulic Conductivities for each model layer#
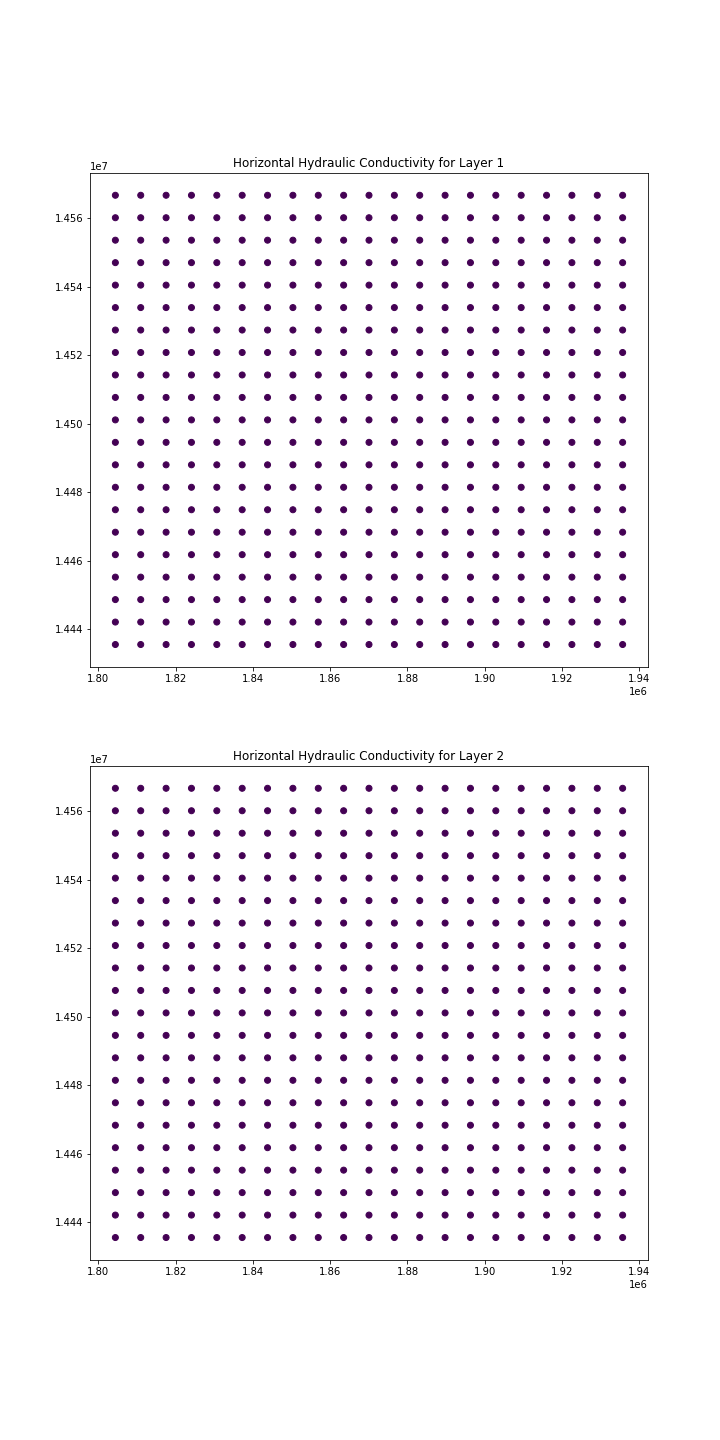
fig, ax = plt.subplots(nrows=aquifer_hk.shape[0], figsize=(10,20))
ax[0].scatter(nodes.X, nodes.Y, c=nodes.Layer1_HK)
ax[0].set_title("Horizontal Hydraulic Conductivity for Layer 1")
ax[1].scatter(nodes.X, nodes.Y, c=nodes.Layer2_HK)
ax[1].set_title("Horizontal Hydraulic Conductivity for Layer 2")
Terminate the Model Object#
sm.kill()
sm.close_log_file()