PyWFM Tutorial 3#
Created by: Tyler Hatch/DWR
Description: This tutorial walks a user of pywfm through how to retrieve simulated groundwater heads for a model layer and plot them.
Important
This tutorial assumes the model has run successfully and all outputs are available to use for inquiry
Getting Started#
import numpy as np
import pandas as pd
import matplotlib.pyplot as plt

from pywfm import IWFMModel
Set Paths to the Preprocessor Input File and Simulation Input File#
# specify paths to preprocessor and simulation main files
pp_file = '../Preprocessor/PreProcessor_MAIN.IN'
sim_file = 'Simulation_MAIN.IN'
Important
These paths assume this code is saved in the simulation folder of the Sample Model and the DLL is in a location relative to the simulation folder
Create the Model Object#
sm = IWFMModel(pp_file, sim_file)
Retrieve Node IDs and Node Coordinates#
nodes = sm.get_node_info()
Note
the get_node_info method returns the data in a pandas DataFrame object
Retrieve Simulated Heads for Model Layer 1#
dates, heads = sm.get_gwheads_foralayer(1)
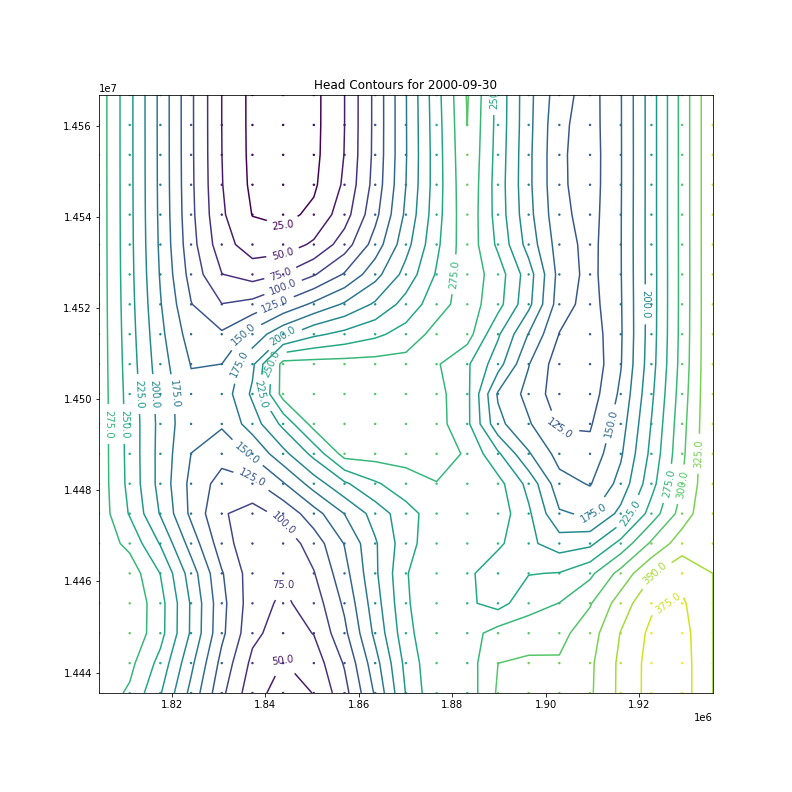
Plot Head Contours for Model Layer 1 for the Last Timestep#
fig, ax = plt.subplots(figsize=(11,11))
# set contour interval to start at 25 ft, end at 400 ft with an interval of 25 ft
contour_interval = np.arange(25, 400.1, 25)
# plot head contours
c = ax.contour(nodes.X.unique(), nodes.Y.unique(), heads[-1].reshape(21,21), contour_interval)
plt.clabel(c, fmt='%2.1f')
# plot nodal head values
ax.scatter(nodes.X, nodes.Y, s=2, c=heads[-1])
ax.set_title('Head Contours for {}'.format(dates[-1]))
Note
This approach using matplotlib.pyplot.contour will only work because the mesh is a rectangular mesh. For irregular meshes consider: matplotlib.pyplot.tricontour
Terminate the Model Object#
sm.kill()
sm.close_log_file()